

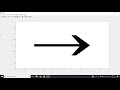
MATLAB code for Arrow
%Code:
figure;
axis([-7
3 -2 2]);
pause(1);
pause(1);
hold
on;
t=0:2*pi/3:2*pi;
x=cos(t);
y=sin(t);
x1=[x(1)
x(2) -1 0 -1 x(3) x(1)];
y1=[y(1)
y(2) y(2) 0 -y(2) y(3) y(1)];
plot([0 0 -5 -5 0],[0.1,-0.1,-0.1,0.1 0.1],'k');
pause(1);
fill([0 0 -5 -5],[0.1,-0.1,-0.1,0.1],'k');
pause(1);
hold
on;
plot(x1,y1,'k');
pause(1);
fill(x1,y1,'k');


No comments