

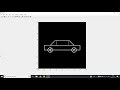
Car drawing in MATLAB
MATLAB Program.
Code:
figure;
pause(5);
axis([-20
20 -6 6]);
fill([-20 -20 20 20],[-20 20 20 -20],'k');
axis
square;
pause(1);
%axis
equal;
hold
on;
plot([-10
-6 6 10 -10],[0 4 4 0 0],'w','linewidth',3);
axis
square;
pause(1);
hold
on;
plot([-15
15 15 -15 -15],[0 0 -4 -4 0],'w','linewidth',3);
axis
square;
pause(1);
grid
on;
%axis
equal;
t=0:0.01:2*pi;
x=-10+2*cos(t);
y=-4+2*sin(t);
plot(x,y,'w','linewidth',3);
pause(1);
plot([-5
-5],[0 4],'w','linewidth',1.5);
pause(1);
plot([5
5],[0 4],'w','linewidth',1.5);
pause(1);
t=0:2*pi/8:2*pi;
x=-10+2*cos(t);
y=-4+2*sin(t);
for i=1:length(t)
plot([-10 x(i)],[-4 y(i)],'w','linewidth',2);
pause(0.5);
end
pause(1);
t=0:0.01:2*pi;
x=10+2*cos(t);
y=-4+2*sin(t);
plot(x,y,'w','linewidth',3);
pause(1);
t=0:2*pi/8:2*pi;
x=10+2*cos(t);
y=-4+2*sin(t);
for i=1:length(t)
plot([10 x(i)],[-4 y(i)],'w','linewidth',2);
pause(0.5);
end
axis
square;


No comments