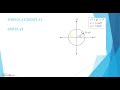
Plot a unit circle using sine and cosine functions in MATLAB
MATLAB Program:
syms t; t=0:0.001:2*pi; x=cos(t); y=sin(t); plot(x,y); axis square
syms t; t=0:0.001:2*pi; x=cos(t); y=sin(t); plot(x,y); axis square


In today’s technology-driven world, digital signal processing and image processing play a major role in communication systems, medical imag...


No comments