

Grayscale Image & Color Image Histogram | MATLAB
% Histogram: a graphical display of data using bars of
different heights.
% It is similar to a Bar Chart, but a histogram groups numbers
into ranges .
% The height of each bar shows how many fall into each
range.
clc
clear all
close all
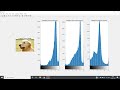
a=imread('Golden.jfif');
subplot(1,4,1);
imshow(a);
title('Original
Colored Image');
rc=a(:,:,1);
subplot(1,4,2);
imhist(rc);
title('Histogram
of the red channel');
gc=a(:,:,2);
subplot(1,4,3);
imhist(gc);
title('Histogram
of the green channel');
hc=a(:,:,3);
subplot(1,4,4);
imhist(hc);
title('Histogram
of the blue channel');


No comments