

Plot the magnitude plot of Discrete Time Fourier Transform | MATLAB
%Code:-
clc
clear
all
close
all
n=-20:20;
xn=cos(2*pi*0.2*n);
w=-pi:0.01:pi;
for i=1:length(w)
xw(i)=sum(xn.*exp(-1i*w(i)*n));
end
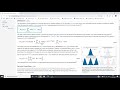
plot(w,abs(xw));


No comments