

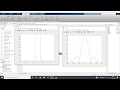
Plot magnitude of Fourier Transform in MATLAB
%Code:-
clc
clear
all
close
all
t=-2:0.001:2;
xct=cos(2*pi*2*t);
plot(t,xct);
figure;
w=-8*pi:0.01:8*pi;
for i=1:length(w)
xcw(i)=trapz(t,xct.*exp(-1i*w(i).*t));
end
plot(w,abs(xcw));
grid
on;


No comments