

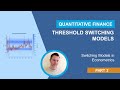
Threshold Switching Models | Switching Models in Econometrics, Part 2
This is the second video in a two part series that shows how to model time series data in the presence of regime shifts in MATLAB®. In this video we use Threshold Switching Models from the Econometrics Toolbox™ to model inflation data across different inflationary regimes.
Highlights:
- Import Consumer Price Index data and visualize monthly U.S. inflation rate
- Set up ARIMA or vector auto-regressive sub models to describe the data in each of the inflationary, normal, and deflationary regimes
- Create a deterministic switching mechanism between different inflation states using threshold transition functionality in the Econometrics Toolbox
- Assemble the switching model using built-in functionality in the Econometrics Toolbox to switch between the sub models in different regimes
- Estimate model parameters, simulate the model over multiple paths and time periods, and forecast model means from current data
- Use the regime-switching example series in the Econometrics Toolbox to get you started: https://bit.ly/3H1rheA
Introduction
Data Import and Visualization
Defining threshold transitions
Assembling the switching model
Simulate and forecast data


No comments