

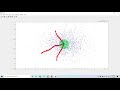
Mean-Shift Clustering Visualization in MATLAB
clc
clear all
close all
warning off
for_circle_drawing_time=0:0.01:2*pi;
t=randn(1,2000);
x=0.7*randn(1,2000);
plot(t,x,'b.');
axis equal;
center_tracker=[];
for
iio=1:5
[m,n]=ginput(1);
hold on;
for_circle_drawing_time_x=m+0.5*cos(for_circle_drawing_time);
for_circle_drawing_time_y=n+0.5*sin(for_circle_drawing_time);
fill(for_circle_drawing_time_x,for_circle_drawing_time_y,'r','FaceAlpha',0.5,'LineStyle','none');
y=[m,n];
data=[t' x'];
temp=0;
Idx=rangesearch(data,y,0.25);
within_circle_elements=data(Idx{1},:);
previous_mean_x=mean(within_circle_elements(:,1));
previous_mean_y=mean(within_circle_elements(:,2));
axis equal;
new_mean_x=0;
new_mean_y=0;
if(iio==1)
center_tracker=[previous_mean_x previous_mean_y];
else
center_tracker=[center_tracker;[NaN NaN];[previous_mean_x
previous_mean_y]];
end
hold off;
while temp==0
plot(center_tracker(:,1),center_tracker(:,2),'ro-','LineWidth',5);
hold on;
y=[previous_mean_x
previous_mean_y];
Idx =
rangesearch(data,y,0.5);
within_circle_elements=data(Idx{1},:);
new_mean_x=mean(within_circle_elements(:,1));
new_mean_y=mean(within_circle_elements(:,2));
if(previous_mean_x==new_mean_x &&
previous_mean_y==new_mean_y)
temp=1;
else
for_circle_drawing_time_x=new_mean_x+0.5*cos(for_circle_drawing_time);
for_circle_drawing_time_y=new_mean_y+0.5*sin(for_circle_drawing_time);
h=fill(for_circle_drawing_time_x,for_circle_drawing_time_y,'g','LineStyle','none','FaceAlpha',0.5);
previous_mean_x=new_mean_x;
previous_mean_y=new_mean_y;
center_tracker=[center_tracker;[previous_mean_x previous_mean_y]];
end
plot(t,x,'b.');
axis equal;
pause(0.25);
delete(h);
end
end


No comments