

How to Make Subplots in MATLAB using Tiledlayout
Learn how to use tiledlayout to create subplots in MATLAB.
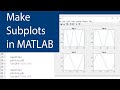
tiledlayout creates a tiled chart layout for displaying multiple plots in the current figure. The layout has a fixed m-by-n tile arrangement that can display up to m*n plots. If there is no figure, MATLAB® creates a figure and places the layout into it. If the current figure contains an existing layout, MATLAB replaces that layout with a new one.
tiledlayout('flow') specifies the 'flow' tile arrangement for the layout. Initially, there is only one empty tile that fills the entire layout. As you call nexttile, the layout reflows as needed to accommodate the new axes while maintaining an aspect ratio of roughly 4:3 for all the tiles.
tiledlayout doc page: https://bit.ly/352Iuo5
If you're using a version of MATLAB earlier than R2019b, here are some links related to the subplot function:
Old subplot video: https://bit.ly/3h1FfiQ
subplot doc page: https://bit.ly/2QXxXC9
Join us on Facebook Group:
https://www.facebook.com/groups/matlabcodes


No comments